The Best Time to Invest in 40 Years

By Janine Cox
Any study of human psychology and investing always reveals how investor sentiment is heightened at the end of a bull or bear market. These studies also highlight that most investors tend to enter the market near the top and exit near the bottom. Despite the market recovering somewhat from the GFC low, it is far from its all-time high, so is now the best time to invest in 40 years?

Taking advantage of market trends
Interestingly, the facts I shared above are widely known by investors and traders, yet when I speak at a seminar, the attendees always seem to finish my sentence when I say that the ‘amateurs buy at the top of market trends and sell at the bottom….’
The educated, however, do the opposite by buying near the bottom and selling near the top. While most investors can quote the statement above, so few understand its true meaning. Investing is about locking in profits, and when it comes to trading market trends, you want to buy near the bottom and sell near the top.
Money flows in the stock market
To understand human emotion, it’s important to consider fund flows into and out of world markets. An ici.org report of net flows into mutual funds in the US between 1996 and 2010 showed that 472 and 878 billion dollars were invested in 2006 and 2007, respectively. However, in 2008, 2009, and 2010, fund flows reduced from 412 billion to minus 149 billion and finally minus 297 billion year on year.
These statistics alone tell me that the amateurs are selling or have sold, and as such, the bottom is near, and the next bull run is about to start. As such, investors need to make the choice now whether to follow the herd or to invest more like educated professionals.
Understanding the economic clock and investing
Let’s face it, markets don’t crash at the top when everyone is sitting on unrealised capital gains. It’s only after the market has experienced a significant fall that the uneducated get nervous and offload stocks. This is exactly what occurred in 2008 and 2009, and in more recent years, as many continue to sell off their stocks and invest in cash. Given we are in 2012, and the market is trending up, have the uneducated got it wrong? In my opinion, I believe the time to invest in cash has past.
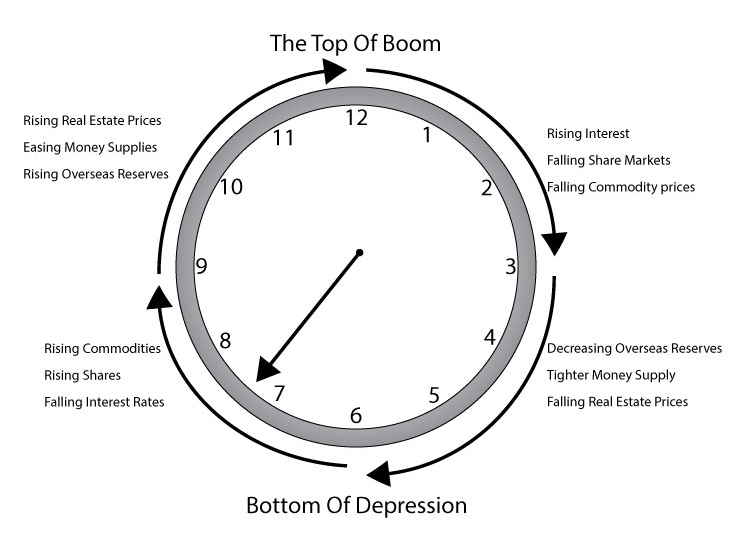
The economic clock below shows that the hand is pointing to a period of falling interest rates, and just prior to this (5 to 7 o’clock), the theme is consistent with what we are currently experiencing around the world. That’s why it is important to really take the time to understand what is happening in the economy, as this is a major reason why some of you will make money from the market while others won’t. But making the right decision today will make a massive difference in your retirement savings over the next decade.
While many investors are understandably wary of the stock market post the GFC, following the herd and locking your money away right now is not the right answer. History has proven that the share market provides the best returns of any asset class, and my current analysis indicates that the best time to invest in 40 years is just around the corner. Let me explain…
Analysing the 40-year lows on the Australian market
Let’s review the history of market trends in 1875 to help you understand how you can prepare yourself to take advantage of the market’s upside.
Australian market 1875 to 1976
Chart 1 below is a yearly bar chart of the Australian market from 1875 to 1976.
There are three important areas to note on this chart: the first is the low in 1892 (the anchor), where the market fell by around 40 percent over five years; the second is the grey-shaded area mid-chart, which is when the crash of 1929 started, with the eventual low occurring in 1931 after falling around 45 per cent; and finally, the third area is the four-year fall of around 60 per cent into 1974 (right-hand side of the chart). So what can we learn from this?
- A 40 per cent plus fall in the stock market is not unusual;
- The market does fall over periods of four to five years;
- There are roughly 40 years between the lows; 39 years between 1892 and 1931, and 43 years between 1931 and 1974;
- The market becomes very bullish for many years after a major fall.
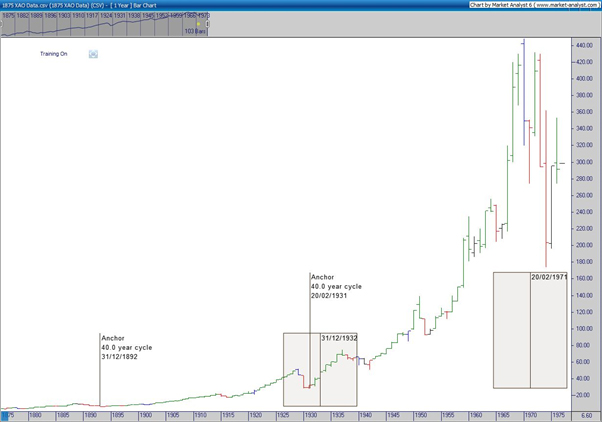
Chart 1
Australian market 1974 to 2014
Chart 2 below shows the fall into 1974 again (boxed area mid-chart). However, we have added the projection of the next 40-year cycle low (boxed area on the right side of the chart), with the midpoint being 2014.
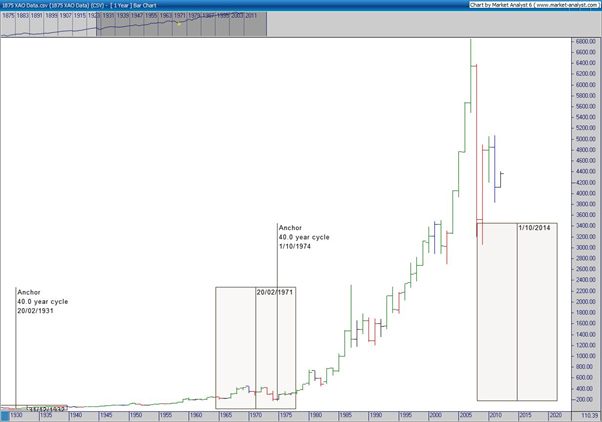
Chart 2
The final graphic is a monthly chart from the low in 1974, on which I have placed some smaller cycles to more accurately determine the timing of our market's next bottom.
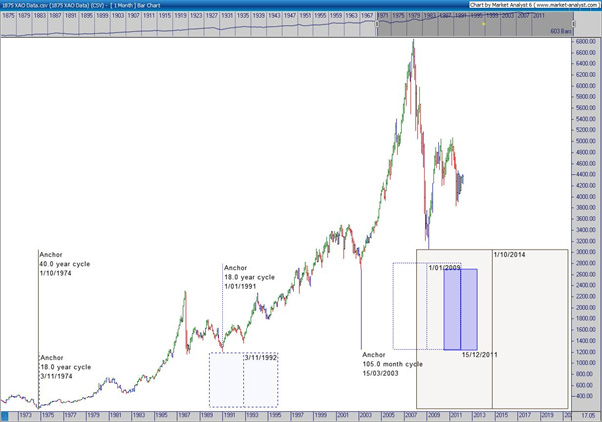
Chart 3
You will notice that I have placed the 105-month or 9-year cycle (blue shaded area), which historically are very accurate in predicting future lows. The current 9-year cycle, if not already in, is due any time now until mid-2013. I have also placed the 18-year cycle (dashed area) on the chart, and you might notice that the low in 2009 fits perfectly into the time frame for this cycle and is also inside the area for the 40-year low to occur. Have I got your attention?
While what I share is not new, very few people have really put it all together. So, what should be your strategy moving forward? I think Warren Buffett says it best: “Buy in doom and sell in boom.”
Critical traits that hold investors back
Since the GFC, many investors have questioned the conventional wisdom about how to profit from the stock market and are beginning to embrace the critical importance of market timing. But there are still two critical traits that cause investors and traders to constantly make mistakes, which include:
- Poor timing, and.
- Lack of patience
While we have already addressed the first point, I will say that this occurs as a direct result of the second point. Yet the second point provides the trigger that alerts me to a possible change in market direction. That’s when everyone is sick and tired of the market and the masses are exiting to the safety of cash. This means I can pretty much assume that anyone who was going to sell has sold, and with no one left to sell, the market has to rise.
Taking advantage of market lows
From the low in 2009, there were two possibilities as to how the market was likely to unfold. The best-case scenario indicated that the long-term low had occurred and that the market was likely to recover to around 5,200 to 6,000 points before continuing to rise back up towards the 2007 high.
The second and worst-case scenario was that the market would move up to around 5,200 points and then continue down to take out the 2009 low, completing the 40-year cycle in a similar fashion to that seen in the early 1970s.
To date, the way the market is unfolding is more aligned with my second and worst-case scenario, where it could pull back to test the 2009 low, if not fall below it. That said, while the market continues to show support at around 4,100 to 4,200 points, this view is inconclusive. But if I am correct, we are heading towards the best and lowest-risk buying opportunity in 40 years, regardless of where the market heads from here. As such, I would encourage investors to take some time to prepare themselves to enter the market again.
Is now the best time to invest?
The challenge is that instead of embracing the opportunity, most investors will wait until years into the bull market before moving away from cash-type investments, and in doing so, miss out on the best and lowest risk part of the bull run. Right now, investors have to weigh up two options:
- If you intend to invest for the long term, you can invest now in good-quality blue-chip shares for five years plus without much risk as long as you are patient. Even if the market falls from its current levels over the next six months, you will reap the rewards over time, as I am confident that the share market will significantly outperform any other market over the next five years.
- Alternatively, you can sit back and wait for the worst-case scenario to occur. The only thing you are risking is that if the market rises, you will miss out on purchasing some good quality shares at cheap prices.
To finish off this article I want to share a quote that I found recently. “It's so difficult, isn't it? To see what's going on when you're in the absolute middle of something? It's only with hindsight we can see things for what they are.” S J Watson
With this in mind, and with what you now know, would you have made a different decision during the GFC? More importantly, what decisions will you make now and in the future? Will you follow the herd, or will you make educated decisions by getting a quality education?