Top Performing Stocks in 2019

By Janine Cox |
In this article we are going to take a look at a selection of the top performing stocks on the Australian market in the first quarter of 2019. We will also take a look at which stocks have performed poorly during the same period. So let’s get into it.

The performance of the Australian share market exceeded expectations in the first quarter of 2019, despite a major period of reckoning for the Australian Banking and Financial Services Industry from the Royal Commission, and mounting uncertainty around the looming Australian Federal election.
While my analysis indicated a strong rise was likely to occur in the first half of 2019, it also suggested that the market was likely to take a breather and pull back temporarily near the end of the first quarter or just after this period. However, the market has continued to trade higher largely unabated.
If we review the period from 1 January to 31 March 2019, the All Ordinaries Index gained 9.7 per cent. More importantly, the All Ordinaries Index (XAO) has traded well above resistance at around 6,200 points and continued to rise in the second quarter to be trading just shy of the high in August 2018 at 6,481.3 points. At the time of writing, the XAO was up by approximately 12.3 per cent.
Interestingly, following the low in December 2018 to the present, the XAO has closed higher than it opened for 13 out of 17 weeks, which confirms the strength of the buyers. As the market was still rising this week, the bulls are still clearly in control.
Which sectors contributed most to the market’s first quarter gains?
The top four performing sectors for the first quarter of 2019 were Information Technology (+19.9%), Materials (+15.7%), Telecommunications (+14.3%) and Energy (+13%). The sectors that significantly underperformed include Financials (+4.8%), Healthcare (+5.7%) and Consumer Staples (+4%). You can also learn more about the best sectors to invest in 2019.
What is surprising is that no sector was in the red at the end of the first quarter this year. So, let’s take a look at some of the stocks that have contributed to the market’s outperformance in 2019.
First-quarter top performing stocks in 2019
In the first quarter, a number of stocks made gains in excess of 60 per cent. Of course their market capitalisation will determine the contribution these gains have had to the overall market. Below are three of the winners for the previous quarter.
Afterpay Touch Group Ltd (APT) + 69%
APT is in the Information Technology sector and has a market capitalisation of around $5.48 billion. The company provides a platform that allows retail merchants to offer customers the ability to buy products on a 'buy now, pay later' basis without a traditional loan. The company’s expansion into the United States has exceeded expectations and the benefits are likely to continue to flow to their bottom line.
Following the high at $23 in August 2018, APT fell to a low of $10.36 in November 2018. While APT had commenced the next rise by the end of 2018 the share price was still down by approximately 46 per cent from the high. Since then the stock has had a strong rise of around 69 per cent to the end of the first quarter 2019.
Recently APT achieved a high of $25.85 before price started to fall away and at the time of writing APT had fallen to approximately $23. Despite the fall, APT is still up by approximately 85 per cent from previous levels traded on 2 January 2019.
While the stock remains bullish overall, APT is unlikely to repeat its first quarter performance in the current quarter. Eventually all bullish stocks pull back in price and currently the analysis indicates that APT has the potential for a further short decline prior to confirming support to continue its uptrend.
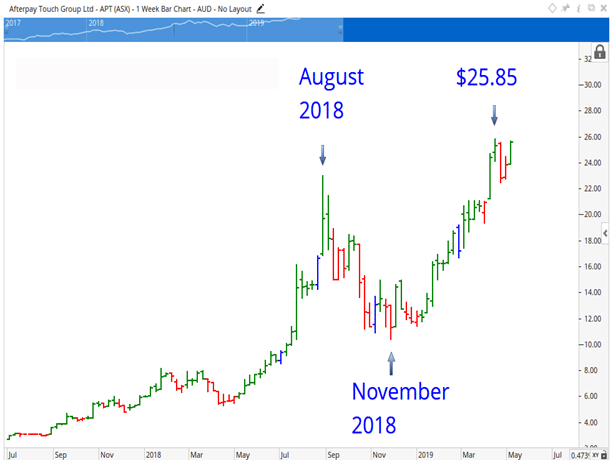
Weekly Chart of Afterpay Touch Group Click to see the image in full size
Fortescue Metals Group Limited (FMG) + 71.7%
The combination of surging iron ore prices and supply problems following the latest dam disaster in Brazil has accelerated gains in FMG’s share price in the first quarter of 2019. Plans for a joint venture expansion with Formosa Steel in Pilbara, Western Australia, estimated to be worth $3.7 billion has further accelerated gains in FMG’s share price.
FMG opened the year at $4.18 per share and by the end of the first quarter had traded to $7.11, above an important level of resistance at approximately $7, representing a gain of around 71.7 per cent. This was followed by further gains to a high of $8.24 in April 2019. FMG has since fallen to approximately $7.20.
While the chart indicates that FMG remains bullish for the medium term, and there is potential for further growth in the current quarter to around $9, the risk has increased for FMG’s share price to pull back to test buyer support between $6 and $7 in the coming months. It’s important to remember that despite the company’s size, at around $24 billion, FMG can be classed as a volatile stock. Volatility in the share price combined with a solid trading plan makes FMG one of my favourite stocks in the Materials sector.
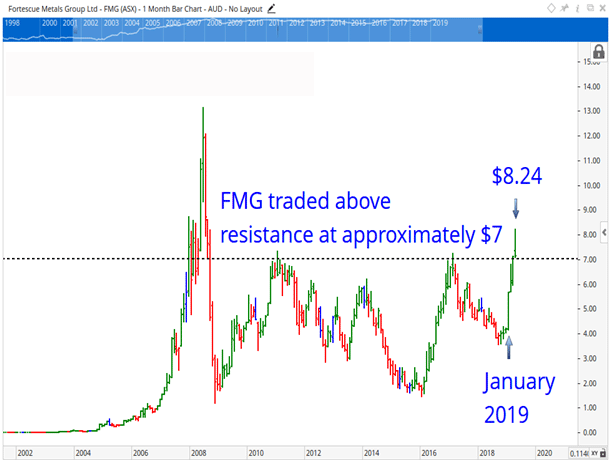
Monthly Chart of Fortescue Metals Group Click to see the image in full size
Appen Ltd (APX) + 71.5%
Like APT, Appen Limited is classed as a tech stock, with market capitalisation of around $3 billion. Appen’s 2018 full year results smashed expectations with revenue up 119 per cent to $364.3 million, EBITDA up 153 per cent and NPAT up 148 per cent. The company also recently acquired Figure Eight Technologies for $125 million, which the market deemed positive for growth. In response to APX’s good story, the share price has continued to make new all-time highs in 2019.
APX opened the year at $12.99 per share and by the end of the first quarter had traded to $22.28, a gain of approximately 71.5 per cent. This was followed by further gains to a high of $26.03 in April 2019.
While the chart indicates that APX is currently bullish, and has the potential to trade up to around $30 in the short term, the analysis also indicates that the risk is high for the share price to reverse and fall to approximately $19 in the current quarter, prior to commencing the next rise.
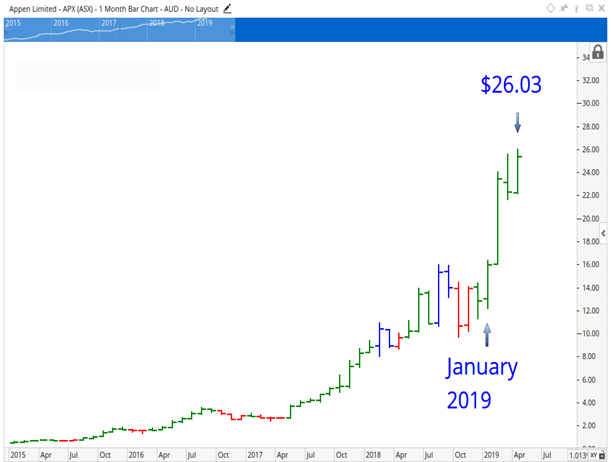
Monthly Chart of Appen Click to see the image in full size
First-quarter poor performing stocks in 2019
Just as it was easy to identify the winners on the Australian market, this was also the case when it came to looking for the biggest losers. Outlined below are three losers for the first quarter of 2019, which are often made up of a higher concentration of smaller companies by market capitalisation.
Interestingly, it is this area of the market where beginners who start out trading the stock market end up following tips, and fall off the deep end as they attempt to make it rich quick. Unfortunately, those with the least amount of knowledge, skill and experience attempt to trade these high risk areas of the market only to lose. And it happens over and over again. But it does explain why the masses continue to view the stock market as risky. If you are truly serious about your success in the market, you need to learn how to trade stocks the right way because your education, or lack thereof, will cost you one way or another.
Eclipx Group Ltd (ECX) – 73%
If you can say the name of this company on the first attempt you are doing well. ECX’s share price has experienced a roller-coaster ride so far this year. A failed merger and poor financials provided justification for heavy selling, which caused ECX to plummet in the first quarter of 2019.
ECX is a reminder that if a stock has been falling, never assume that it won’t trade lower. The stock continued its decline from a high of $4.36 in November 2017 through to $0.54 in March 2019, before recovering slightly at the end of the quarter. Looking at the quarterly performance, ECX opened the year at $2.38 per share but by the 31 March 2019 it had fallen to $0.64, a loss of approximately 73 per cent.
The weekly chart reveals how ECX’s share price gapped down in March on negative news and is now attempting to recover. ECX has a market capitalisation of around $330 million.
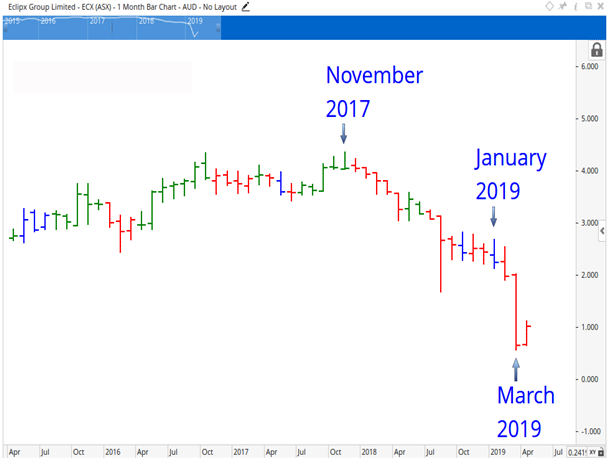
Monthly Chart of Eclipx Group Click to see the image in full size
St Barbara Ltd (SBM) – 28.6%
The mining sector has been the second-best performer in 2019, yet St Barbara Limited has struggled in the first quarter of 2019. Delays to operational activities has resulted in production guidance cuts and, concerns over the feasibility of its Gwalia mine contributed to the shares being sold off heavily in the second quarter. The company has a market capitalisation of around $1.68 billion.
Interestingly, the share price hit a heavy level of resistance at approximately $5.20 in July 2018 and February 2019. This is the level the stock rose to in 2008 before reversing strongly. So this level has been a major psychological resistance level for SGM.
SBM opened the year at $4.72 per share and initially traded higher to $5.32 in February before it turned and fell to $3.37 by the end of March 2019. The decline in the previous quarter was 28.6 per cent.
While the chart indicates that SBM may rise in the short term, it also confirms that the stock is currently bearish, and that momentum is likely to be largely on the downside in the current quarter.
The analysis also indicates that the risk is high for a further fall to between $2.10 and $2.70. Given this, SBM needs some positive news to report to the market very soon to bring the buyers back and, to allow the share price to trade back above an important level at around $4.
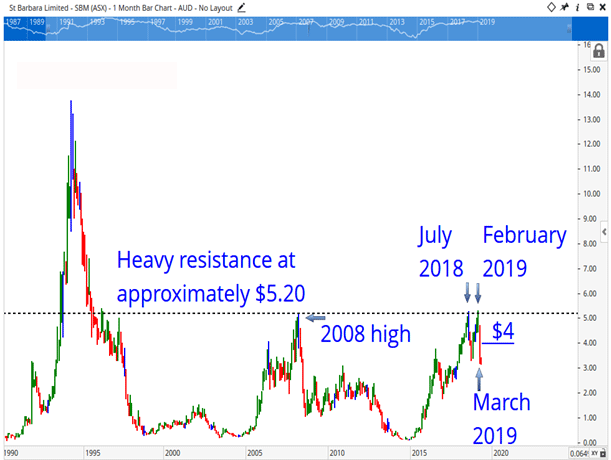
Monthly Chart of St Barbara Click to see the image in full size
Blackmores Limited (BKL) – 26.56%
This supplement provider has struggled in recent years, with the share price down by around 60 per cent from its all-time high of $220.90 in 2016. BKL has a market capitalisation of around $1.6 billion.
Following on from the declines in BKL’s share price in 2018, the stock has continued lower this year, therefore, 2019 is likely to be another disappointing year for the stock. In February 2019, the market responded swiftly to a disappointing half year earnings report and the share price plummeted to a low of $80.45, before recovering slightly to trade above $93.
In January 2019, BKL opened at $124 but by the end of the quarter the share price had lost approximately 25 per cent of its value.
While the chart indicates that BKL is attempting to find support from buyers at around $90, and therefore, has the potential to rise in the short term, the stakes are high right now. A further swift fall and a strong close below this level at the end of any week is likely to be followed by a decline to between $50 and $70.
Another technical risk also exists for BKL, as it is currently trading below a critical level at around $110. The longer the stock trades below this price, the greater the risk of a further decline. Only the news of a turnaround in the company’s fortunes would prevent this move from occurring and avert further deterioration in the share price in the coming months.
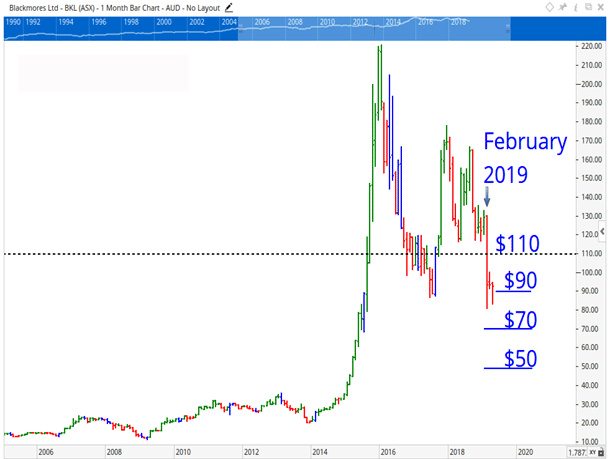
Monthly Chart of Blackmores Click to see the image in full size
Others who read this article also enjoyed reading:
Dale Gillham's latest award winning book, Accelerate Your Wealth, It's Your Money, Your Choice is also packed with many simple, but powerful investment strategies that will provide you with the confidence to invest directly in the stock market.
And If you would like to learn how to trade stocks with more confidence so that you profit on a consistent basis, view our trading courses. You can also check out what our clients have to say by viewing their reviews, success stories and testimonials.